- Judge AI and human calls on the same definitions: resolution, first-call resolution, hand-off quality, abandonment and cost per resolved call.
- Containment alone misleads, because a caller who gives up counts as contained. Pair it with a repeat-call check within 72 hours.
- Divide cost by resolved calls, not by all calls, and take your own baseline before you compare. National benchmarks are only a sanity check.
Which AI voice agent metrics matter
Track nine numbers, and measure AI calls and human calls on the same definitions: containment, hand-off rate, hand-off quality, task completion, first-call resolution, average handle time, abandonment, complaint and opt-out rates, and cost per resolved call. Resolution matters most. A call the AI "handled" that comes back tomorrow is a failure, however it looks on a dashboard.
Disclosure: VoiceGenie publishes this guide and sells AI agents and a human desk, so we care about these numbers. The definitions hold whichever tool you use. For the wider playbook, see our contact centers page. This post goes deeper on what to count and what to distrust.
The reason to be strict is that national baselines are poor to begin with. US contact centers averaged a 99 second speed to answer and 8.9% abandonment in 2024 [2]. Post-call wrap-up took 13.7% of agent time in the same report [2]. Any new tool is judged against that, and against what customers tolerate: in a 2026 Gartner survey of 3,566 customers, 87% said a way to reach a human is essential when companies use GenAI [5].
mean US agent attrition in 2024; 18% of surveyed centers lose over 25% of new agents within 3 months. ContactBabel.2
average speed to answer in US centers in 2024, up from 31 s in 2012. Abandonment was 8.9%. ContactBabel.2
of US agent time is post-call wrap-up, more than idle time at 12.2%. ContactBabel, 2025 guide.2
of service organizations reached the AI return they expected; 24% report any positive return. Gartner, reported Nov 2026.7
The scorecard: nine metrics, each with its trap
Each row gives the formula, the version that misleads, and a benchmark where a sourced one exists. Where none exists, the table says so rather than guess.
| Metric | How to measure it | The misleading version | Benchmark |
|---|---|---|---|
| Containment | Calls the AI ended with no transfer, over AI-answered calls | Counting callers who hung up | None independent |
| Hand-off rate | Calls transferred to a person, over AI-answered calls | Low rate read as success when it means a trapped caller | 12.0% of US calls transferred, 2022 [3] |
| Hand-off quality | Sampled transfers where the person did not re-ask the reason or identity | Asking leaders instead of auditing calls | 83% of consumers say they repeat themselves [6] |
| Task completion | Calls where the goal event happened: booked, paid, status given | Counting "call ended politely" | None independent |
| First-call resolution | Cases with no repeat contact on the reason within 72 hours | Internal count with no survey | 71% by survey [1]; 78% in ContactBabel's 2022 data [3] |
| Average handle time | Talk plus hold plus wrap-up, by call reason | Judging agents on old AHT after easy calls left | 426 seconds per service call, 2022 [3] |
| Abandonment and speed to answer | Calls that hang up before answer, and seconds to answer, by hour | Daily average that hides the 9 am peak | 8.9% abandoned, 99 seconds, 2024 [2] |
| Complaints and opt-outs | Count per 1,000 calls | Counting only formal complaints | None independent |
| Cost per resolved call | All costs over resolved calls | Dividing by all calls | $6.55 per inbound call, 2022 [3] |
Containment: useful, never alone
Containment is the share of calls that never reach a person. The trap is that it counts a caller who gave up as a success. As CX Network puts it, containment does not measure whether the problem was solved [4]. Its fix: take the contained callers and see who called back on the same issue within 48 to 72 hours [4].
A practical version: match repeat calls by phone number and reason code, for 72 hours after the first call. Report contained-and-not-repeated as your resolution rate.
First-call resolution: say which kind
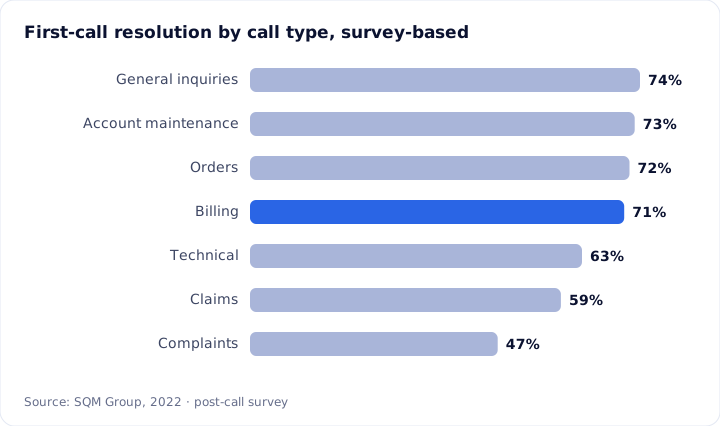
SQM Group's survey benchmark is 71%, with individual centers ranging from 40% to 91% [1]. SQM finds internal counts overstate FCR by 10 to 20 percent compared with post-call surveys [1]. ContactBabel's 2022 figure of 78% is higher than the survey benchmark [3], and the source does not say how it was measured. Do not compare your internal number with a survey benchmark.
The call type matters more than the average. A center with many complaints will look worse than one that mostly takes orders, and neither is failing.
Average handle time: it will rise for people
When the AI finishes the easy calls, the calls left for agents are harder. Their AHT can rise while the center gets better. Re-baseline AHT by call reason, and do not judge agents against last quarter's mix. Watch wrap-up separately, since it took 13.7% of agent time in the 2025 ContactBabel data [2].
Hand-off: the metric most dashboards leave out
A hand-off has two numbers. The rate tells you how often the AI passes a call on. The quality tells you whether the person could carry on without asking the caller to start over.
Leaders and callers disagree on this. In Five9's 2026 survey, a vendor study of 3,600 people in the US, UK and Germany, 96% of business leaders said context is preserved in AI-to-human hand-offs, while 83% of consumers said they repeat themselves after a transfer [6]. Audit it yourself.
How to audit hand-offs each week:
- Pull 20 transferred calls at random.
- Read the first 30 seconds of the human part. Did the person ask for the reason, the name or the account again?
- Count the calls where they did. That share is your repeat-yourself rate.
- Check whether the person saw the summary, transcript, caller mood and what the AI had already done. On VoiceGenie the Human Agent Desk shows all four.
Also read hand-off rate with care. A very low rate can mean a caller could not find the way out. Gartner advises against making GenAI a mandatory first step, since customers pushed through several failed AI attempts are less likely to use it again [5]. Make "agent" work at every step.
Cost per resolved call, worked through
Cost per resolved call is the metric a finance lead will repeat. The trap is dividing by all calls. Divide by the calls that were solved with no repeat contact.
Here is an illustration with made-up volumes, not a VoiceGenie result. The AI answers 1,000 calls of 4 minutes each. It resolves 600. The other 400 go to people, who resolve them.
- AI cost: 4,000 minutes at $0.14 per minute, billed per second, plus your own carrier charges, which VoiceGenie does not bill.
- Human cost for 400 hand-offs: at the 2022 US average of $6.55 per inbound call [3], that is $2,620. Use your own loaded cost per call, since this is a 2022 national average.
- Total, divided by 1,000 resolved calls, gives the blended cost per resolved call.
Now stress it. If 100 of the 600 "resolved" calls come back within 72 hours, they are not resolved and the denominator shrinks. If the AI repeats the work, you pay for each attempt. This is why the repeat check sits under every other metric.
Put your own volumes into the calculator:
A worked example. Move the sliders to match yours.
AI at $0.14 a minute with volume credit applied, plus Insights seats for the people who take handed-over calls. Phone line charges are your carrier's and are not included. Illustration, not a quote. Open the full calculator
Complaints, opt-outs and abandonment
These three catch what the rest miss.
Abandonment is calls that hang up before an answer. Report it by hour, because a daily 8.9% [2] average hides a 9 am peak that is far worse. If you use the AI for overflow, the target is a fall in abandonment in the covered hours.
Complaints and opt-outs are counted per 1,000 calls, for AI and human calls alike. I found no independent benchmark for either, so your baseline is the only reference. Count any caller who says "stop calling", "remove me" or "I want a person", not only formal complaints. On outbound campaigns, VoiceGenie can set quiet hours, retry limits and do-not-call suppression, and its API can remove a contact from a multi-step dialing sequence. Watch opt-outs after any script change.
Task completion sits beside these. Define the goal event for each call type before launch: an appointment booked, a payment link sent and opened, a status given. Pull it from the post-call webhook, which VoiceGenie sends after every attempt with the full conversation record and post-call analysis.
A two-week setup, and when this is the wrong approach
Week 1: baseline. Tag your top 15 call reasons for the queue you will change. Record speed to answer, abandonment, transfers, repeat calls and AHT by hour. Write your pass marks now and do not move them later.
Week 2: test. Staff place 40 calls, including angry callers and "agent" said at every step. Read every transcript. Turn on the AI announcement if your policy needs it; on VoiceGenie it is a setting you switch on per agent. Then run one call type live, and score all calls, AI and human, on the scorecard above.
When not to rely on this: if you take under a few hundred calls a month, the percentages swing too much to read, so listen to calls instead. If calls are mostly disputes and distress, a resolution metric favors the AI poorly, and the better measure is agent time freed. Also, if you only need an IVR or a human-only desk, a narrower tool may suit you better. VoiceGenie covers AI calls and a human desk on one record, and you bring your own carrier. See pricing for current rates.
For common set-up errors that wreck these numbers, read mistakes to avoid when setting up an AI caller. For the basics, see what is an AI voice agent.
Common questions
What is a good containment rate for an AI voice agent?
There is no independent benchmark, and vendor figures rarely define the term. Containment is the share of calls that never reach a person, so callers who gave up count as contained. Set your target on resolution instead: contained calls with no repeat call on the same reason within 72 hours, compared against your own agents.
What is the difference between containment and resolution?
Containment says the AI did not transfer the call. Resolution says the caller's problem was solved. A caller who hangs up in frustration is contained but not resolved. Measure resolution by checking whether the same number calls back about the same reason within 48 to 72 hours, and by a short post-call survey.
What is a good first-call resolution rate?
SQM Group's 2022 benchmark is 71% when measured by post-call survey, with centers ranging from 40% to 91%. Rates differ by call type: orders 72%, billing 71%, technical 63%, claims 59%, complaints 47%. SQM says internal counts overstate FCR by 10 to 20 percent versus post-call surveys, so compare like with like.
How do you calculate cost per resolved call?
Add all costs for a period: AI minutes, phone line, agent time, software. Divide by the number of calls resolved with no repeat contact, not by all calls. Include the cost of the calls handed to people. If a cheap call fails and the caller phones back, the second call belongs in the same case.
Which metrics should I track in a voice AI pilot?
Track resolution, hand-off rate and hand-off quality, first-call resolution, abandonment, complaints and opt-outs per 1,000 calls, and cost per resolved call. Capture your own two-week baseline first, by hour. Add average handle time for human calls, and read it knowing the easy calls have left the queue.
Sources
- SQM Group, What Is a Good First Call Resolution Rate?, 2022
- ContactBabel, The US Contact Center Decision-Makers' Guide 2025 (17th edition)
- ContactBabel, The US Contact Center Decision-Makers' Guide 2023 (15th edition), Figure 6
- CX Network, Your contact center AI is succeeding, but are your customers still suffering?
- Gartner, Survey Finds 87% of Customers Say Companies Using GenAI for Customer Service Must Provide Access to a Human Agent, 2026
- CMSWire, reporting Five9's 2026 CX report (vendor survey of 3,600 respondents in the US, UK and Germany)
- CMSWire (reporting a Gartner survey), Just 4% of Customer Service Leaders Hit Their Expected Automation Returns (2026)
About this post. The rules, prices and figures here were gathered from public sources and were correct to the best of our knowledge on the date shown. They change, and they differ by country and state. This is general information, not legal or financial advice. Before you act, check the latest position with the regulator or company concerned, using the links above. If you spot an error, write to support@voicegenie.ai.
Content marketing associate at VoiceGenie. Writes guides on setting up and running AI voice agents.
More posts by Rohit Singh